



Marketing reports can look impressive. Traffic is up. Clicks are growing. Impressions are climbing. Cost per click is down. Everything seems to be moving in the right direction. But there’s one question that matters more: Is all that activity helping the business grow?
That’s where marketing reporting can get tricky. A dashboard might contain plenty of numbers while still leaving out the context needed to understand what those numbers actually mean. A campaign can generate hundreds of leads but very few customers. Organic traffic can increase while inquiries stay flat. An ad can have an excellent click-through rate while sending people to a page that barely converts.
Clear reporting should connect marketing activity with meaningful business outcomes. It should help you understand what’s working, what’s underperforming, and where your next marketing dollar could work harder. In this guide, we’ll break down why reports sometimes create an incomplete picture, which metrics deserve more context, and how to build reporting that supports smarter decisions. Let’s take a look!
More Numbers Don’t Always Mean More Clarity
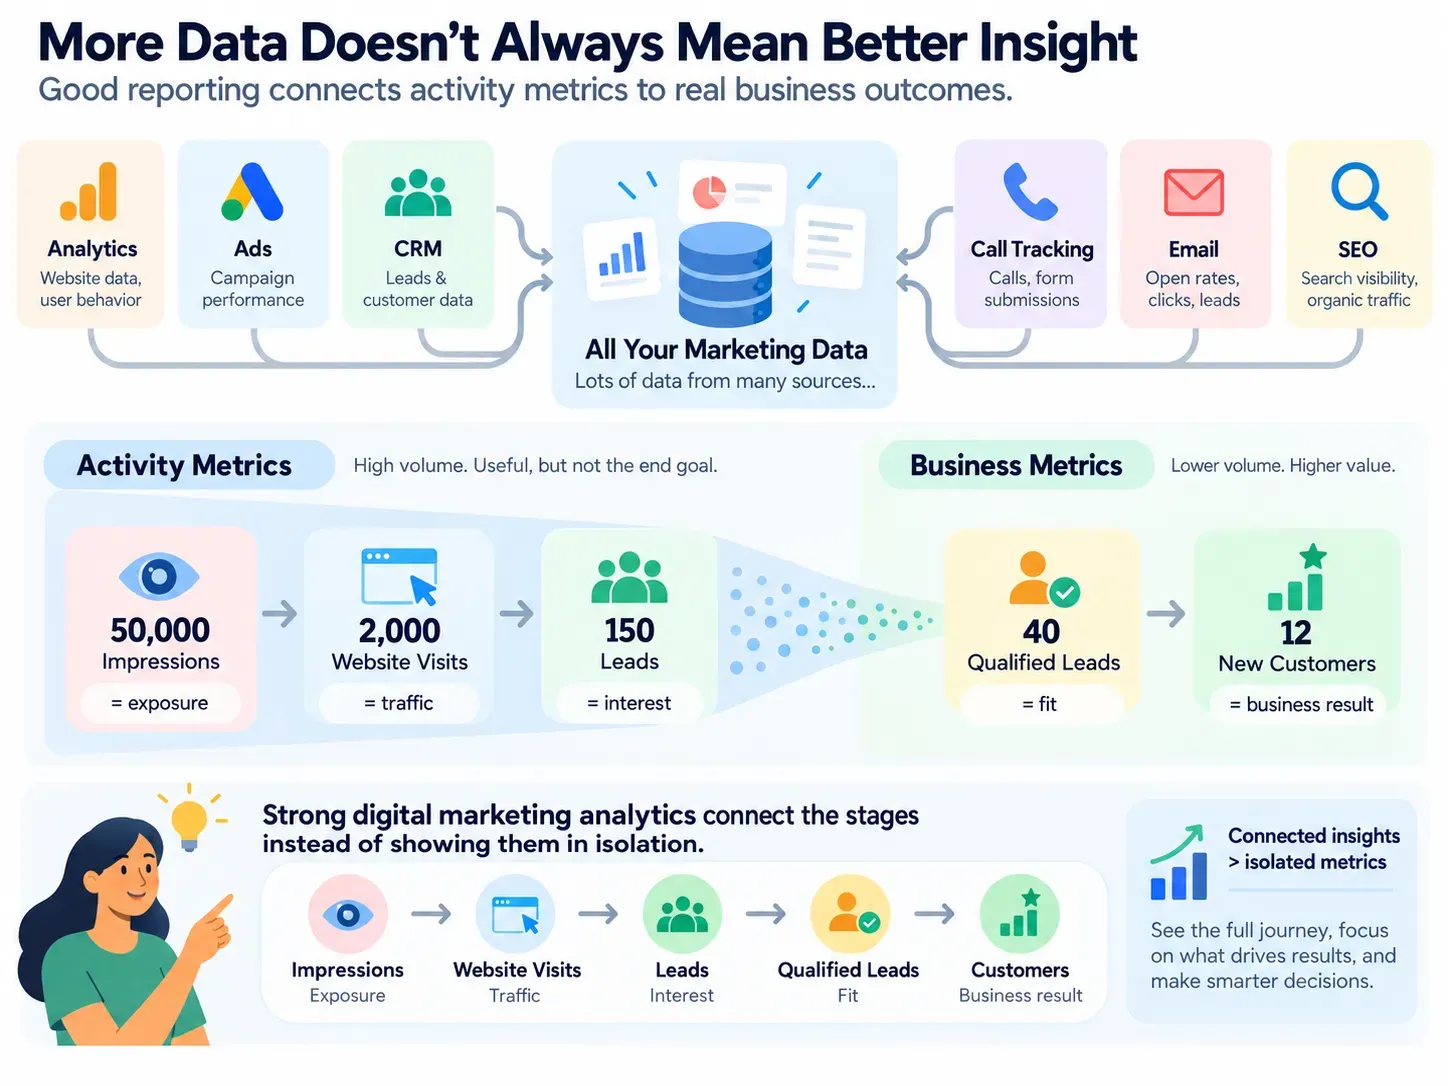
One of the easiest reporting mistakes is assuming that more data automatically produces better insight. Modern marketing platforms can track an enormous amount of activity. Google Analytics, advertising platforms, CRM systems, call tracking tools, email software, and SEO platforms can all produce their own reports. The thing is, not every metric deserves equal attention.
Activity metrics and business metrics aren’t the same
Consider these numbers:
-
50,000 impressions
-
2,000 website visits
-
150 leads
-
40 qualified leads
-
12 new customers
Every number tells you something different. Impressions show exposure. Website visits show traffic. Leads indicate interest. Qualified leads reveal whether those inquiries fit the business. Customers finally connect marketing activity with an actual business result.
If your report stops at website traffic or lead volume, you’re missing part of the story. Strong digital marketing analytics should help connect those stages instead of displaying them in isolation.
Vanity metrics can look better than they perform
Some metrics naturally grab attention because they’re large. A post reaching 100,000 people sounds exciting. So does a website generating 20,000 monthly visits. But those numbers need context:
-
Where did the traffic come from?
-
Was it relevant?
-
Did visitors explore important pages?
-
Did they convert?
-
Did any of those conversions become customers?
This doesn’t mean reach, impressions, traffic, or engagement should be ignored. They simply need to be connected to a larger goal. A smaller campaign generating 20 strong sales opportunities could be more valuable than a campaign generating thousands of clicks from people who never had serious purchase intent.
Attribution Can Change the Story Behind a Conversion
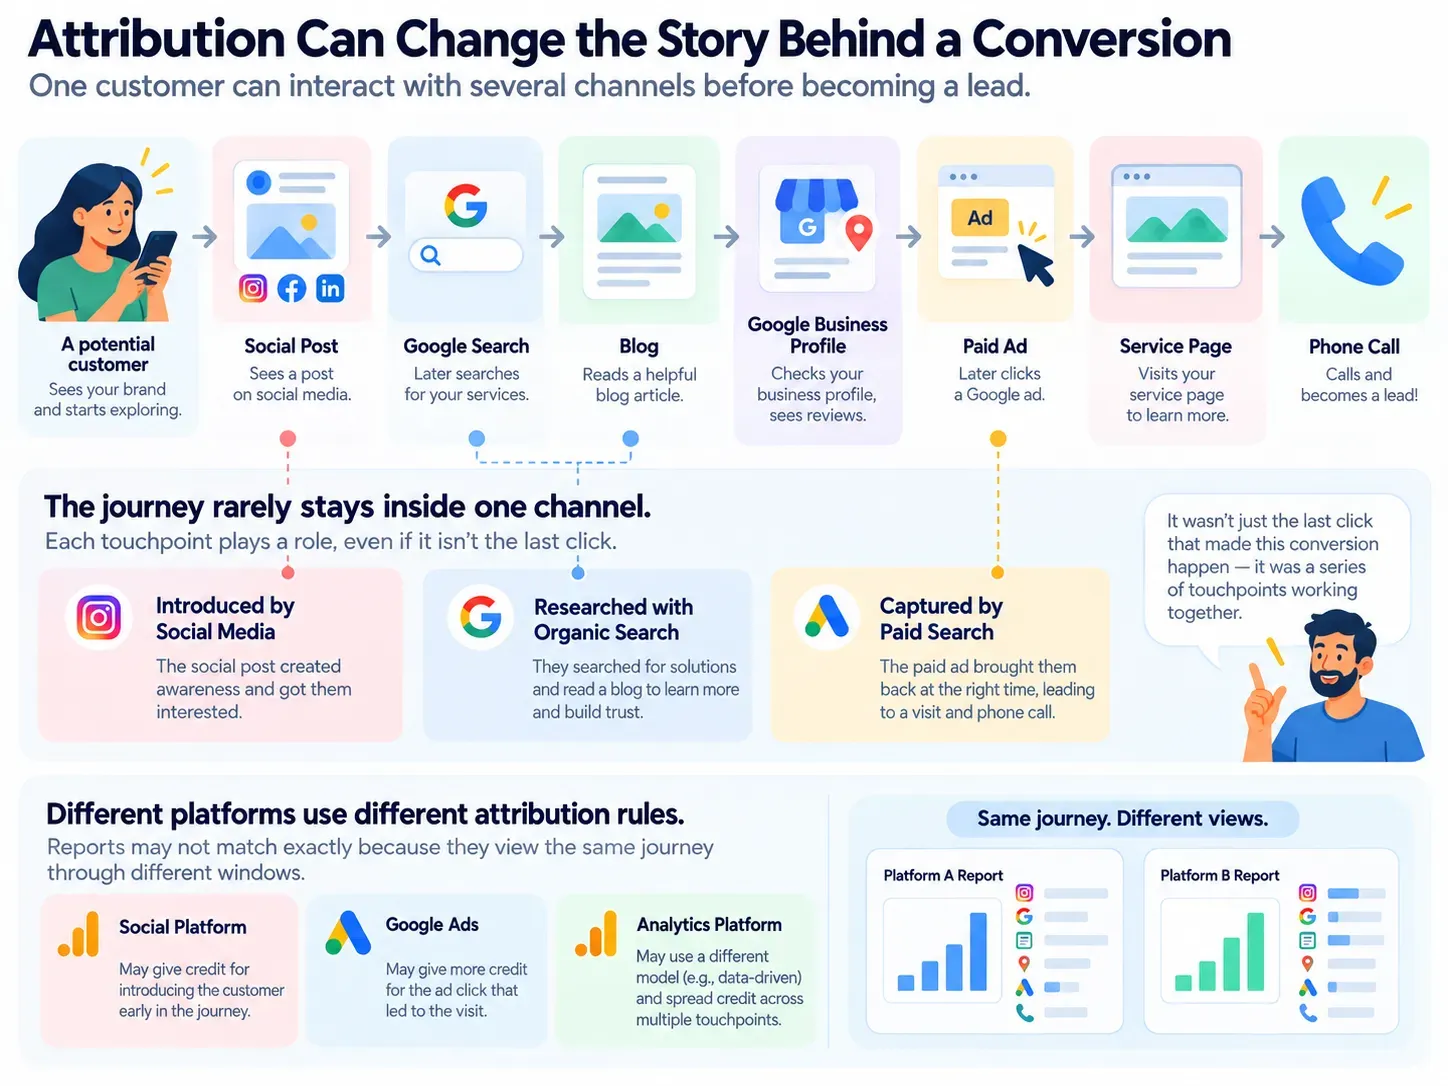
A customer might first encounter your company through social media. Two weeks later, they search your name on Google. They read a blog post, leave, click a paid search ad several days later, and finally call.
Which channel produced the customer? Social media introduced the company. Organic search helped with research. Paid search captured the final action. Your campaign reporting might credit only one of them.
The customer journey rarely stays inside one channel
Different analytics and advertising platforms can apply different rules when assigning credit for conversions. Because of that, reports from two platforms may not always line up perfectly. That doesn’t automatically mean one system is wrong. They’re often looking at the customer journey through different windows.
Don’t judge every channel by the final click
Some marketing channels are better at generating awareness. Others are stronger at capturing existing demand. If you evaluate everything only by the last interaction before conversion, you may undervalue the channels that helped create or strengthen that demand earlier.
This is especially important when reviewing content, SEO, social media, email, and other strategies that can influence decisions across a longer period. Better campaign reporting asks more than, “Where did the final click come from?” It also asks, “What helped move this person toward becoming a customer?”
Leads Aren’t All Worth the Same Amount
Lead volume is one of the most common numbers used to judge marketing success. There’s a good reason for that. Leads matter. But counting leads without evaluating quality can create a misleading view of marketing performance.
Consider two campaigns:
-
Campaign A generates 100 leads at $40 each.
-
Campaign B generates 50 leads at $60 each.
Looking only at cost per lead, Campaign A appears more efficient. Now add sales data:
-
Campaign A produces 10 qualified opportunities and three customers.
-
Campaign B produces 30 qualified opportunities and 12 customers.
Suddenly, the picture looks very different. The campaign with the higher cost per lead may be producing far more business value.
Follow the lead beyond the form submission
To understand how marketing contributes to growth, track what happens after the initial conversion whenever your systems allow it. That might include:
-
Total leads
-
Qualified leads
-
Sales opportunities
-
Appointments
-
Estimates
-
Closed customers
-
Revenue
The farther you can connect marketing activity to actual sales outcomes, the more useful your reports become.
Talk to the sales team
Analytics software can’t always tell you why a lead was poor. Your sales team often can. Maybe an advertising campaign is generating calls, but most callers are outside the service area. Perhaps people are asking for a service you don’t provide. Maybe leads are qualified but the sales team isn’t responding quickly enough.
Those details change how you interpret the numbers. Marketing and sales data should communicate with each other. If marketing reports 200 successful conversions while sales reports only 20 useful conversations, that’s something worth investigating.
Look for Trends, Not Just Isolated Wins and Losses
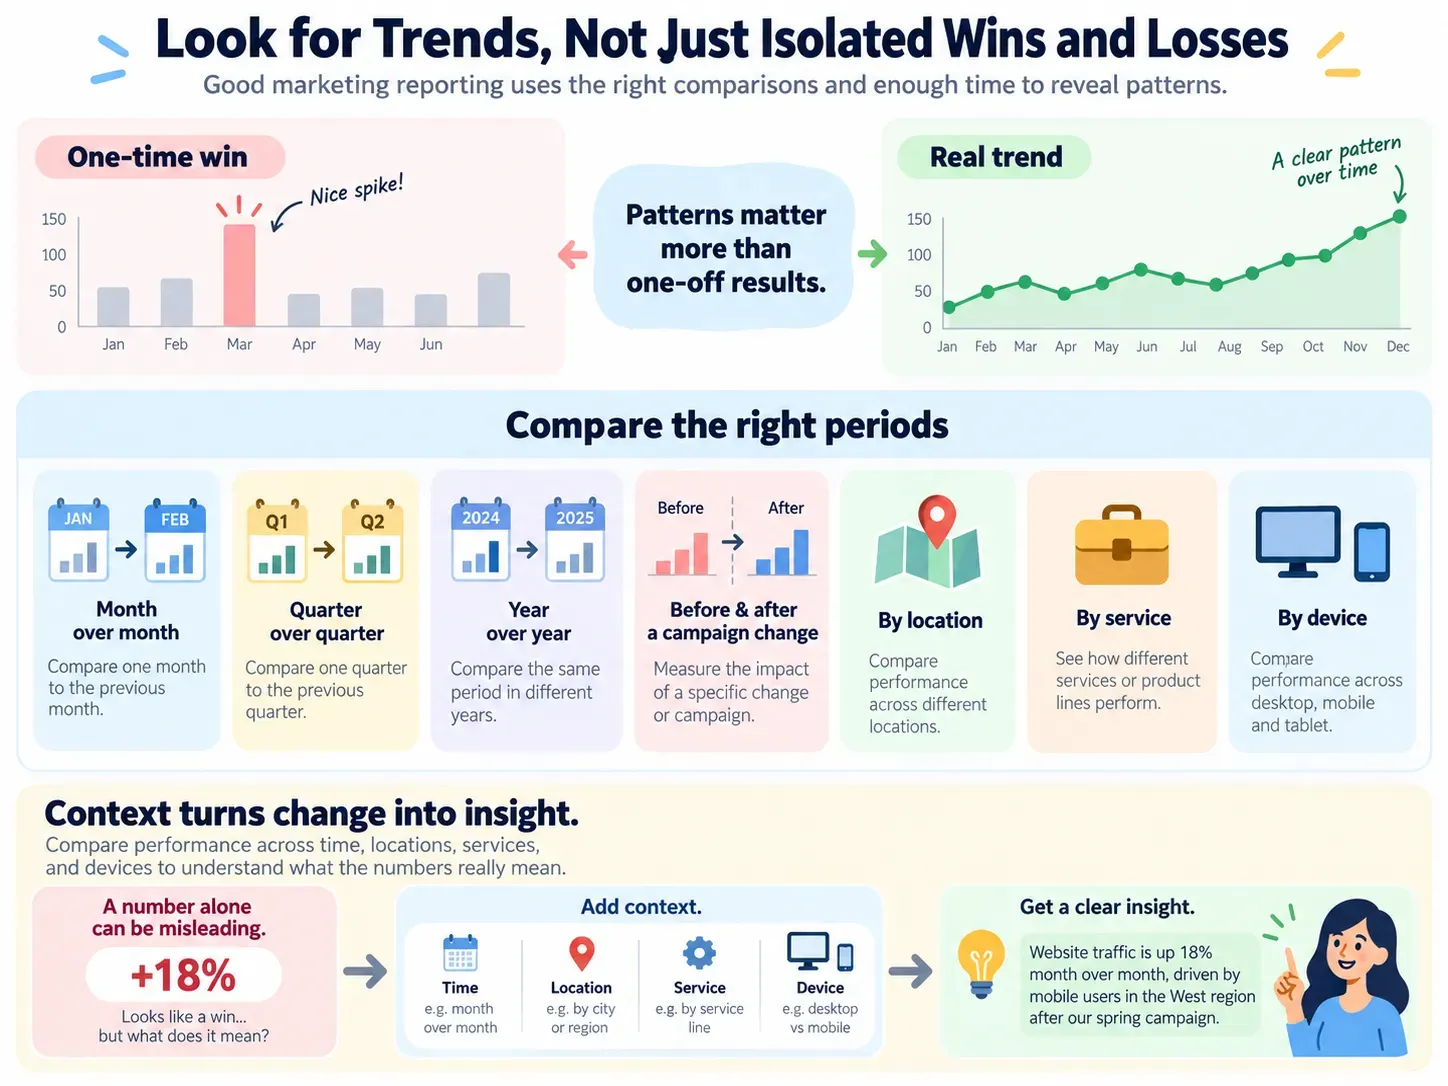
Good marketing reporting needs meaningful comparisons and enough time to identify patterns.
Compare the right periods
Looking at month-over-month changes can be useful, but it isn’t always enough. Some businesses experience strong seasonality. Depending on the business, useful comparisons might include:
-
Month over month
-
Quarter over quarter
-
Year over year
-
Before and after a campaign change
-
Performance by location
-
Performance by service
-
Performance by device
Context turns a percentage change into something you can actually interpret.
Look at trends across the funnel
Suppose organic traffic rises 30%, but organic leads increase only 5%. That’s worth investigating. Maybe the new traffic comes from informational blog content. Perhaps visitors are landing on pages with weak calls to action. Maybe rankings increased for terms that aren’t strongly connected to the company’s services.
Traffic growth isn’t necessarily bad in that situation. It simply needs explanation. Strong digital marketing analytics connects changes across the funnel rather than celebrating one number in isolation.
Build Reports Around Decisions, Not Dashboards
A good report should help answer practical questions:
-
What produced results?
-
What changed?
-
Where are we losing opportunities?
-
What deserves more budget?
-
What needs adjustment?
That’s the difference between reporting data and communicating insight.
Start with business goals.
Before choosing metrics, define what marketing is supposed to accomplish. For many service businesses, the goal isn’t simply generating website visits. It’s generating qualified opportunities that can become customers. Once that goal is clear, work backward. A reporting structure could connect:
Revenue → Customers → Qualified Leads → Total Leads → Website Conversions → Traffic → Visibility
Now the metrics have a relationship. You’re not collecting numbers because a platform happens to provide them. You’re measuring steps connected to a business outcome.
Add context to every major metric
A number becomes much more useful when you can explain:
-
What changed
-
Why it may have changed
-
Whether the change matters
-
What action should come next
Good reporting doesn’t just show the dashboard. It explains the movement behind it.
Keep reports focused
More pages don’t automatically create better reports. If a monthly marketing report takes an hour to interpret, there’s probably room to simplify it. Put the most important information first. That might include:
-
Leads generated
-
Qualified leads
-
Cost per qualified lead
-
Customers acquired
-
Revenue influenced
-
Conversion rate
-
Major channel changes
Supporting metrics can come afterward.
Turn Marketing Data Into Your Next Move
Reporting should create action:
-
If organic traffic is growing but conversions aren’t, review the pages receiving that traffic.
-
If paid ads generate plenty of leads but few customers, investigate targeting, search intent, lead quality, landing pages, and sales follow-up.
-
If one service consistently generates higher-value customers, consider whether it deserves more visibility.
-
If one location has a high conversion rate but low traffic, there may be an opportunity to put more energy behind local visibility.
Ask better questions
Instead of asking:
“Did traffic increase?”
Ask:
“Did relevant traffic increase, and what did those visitors do?”
Instead of:
“Did we generate more leads?”
Ask:
“Did we generate more qualified leads?”
Instead of:
“Did cost per lead decrease?”
Ask:
“Did the cost of acquiring a customer improve?”
Those questions move reporting closer to business outcomes.
Accept that no report is perfect
Tracking has limits. Customers can switch devices. Some people see marketing without clicking it. Others may call after hearing about your company from several different sources. Privacy settings and platform differences can also create gaps. Your report won’t capture every interaction perfectly. That’s okay.
The goal isn’t perfect information. It’s reliable enough information to identify patterns, evaluate progress, and make better marketing decisions. When you combine analytics with CRM information, sales feedback, customer behavior, and business results, the picture becomes much clearer.
Put More Power Behind Every Marketing Decision
Looking beyond surface-level metrics helps you see where your marketing is actually creating value and where your strategy needs more fuel. We know it’s frustrating to invest time and money into marketing only to receive reports that leave you with more questions than answers.
At Hite Digital, we connect strategy, analytics, SEO, paid media, websites, and lead generation to help businesses understand what their marketing is doing and where the strongest opportunities are. If you’re ready for clearer insights and marketing decisions backed by meaningful data, explore Hite’s digital marketing services or connect with our team.